CANCER

Cancer trends in Ireland: How many cancer survivors are there?

The National Cancer Registry was established by the Minister for Health in 1991

Dr Joe McDevitt, Statistician, National Cancer Registry, Cork and Dr Paul Walsh, Epidemiologist, National Cancer Registry, Cork

February 1, 2019

Article
Similar articles
  • It has been collecting comprehensive cancer information for the Republic of Ireland since 1994. The information collected is used in research into the causes of cancer, in education and information programmes, and in the planning of cancer services to deliver the best cancer care to the whole population. 

    The National Cancer Registry (NCRI) reached a milestone in its history last year, as 2018 was its 25th year of data collection. Over this time the registry has observed an increase in number of cancers diagnosed and significant improvements in survival. Completeness of case ascertainment at five years after diagnosis is estimated to be at least 98%.1 Incidence data are collected and coded by the NCRI according to the ICDO3 classification.2

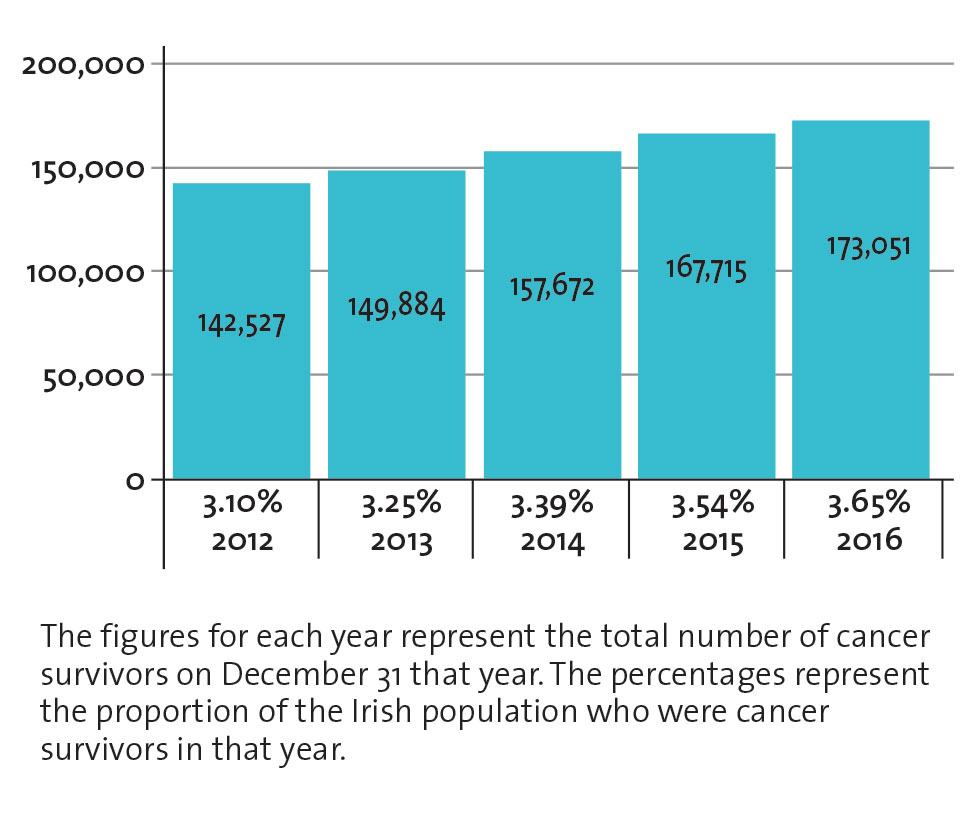
    Complete cancer prevalence is defined as the number of persons surviving with, or following a diagnosis of,  cancer in a given population at a particular point in time – the index date. Cancer prevalence increases as new diagnoses are made and decreases as people previously diagnosed die. Therefore, prevalence is a useful statistic to measure the impact on the health service over the long-term. For a cancer registry, fixed-duration prevalence is the number of cancer survivors calculated directly from observed data collected by the cancer registry since it was established. 

    The NCRI began national collation of cancer registration in 1994 and it currently holds 23 years of complete incidence and follow-up information on cancer cases, up to the end of 2016. However, there remains a hidden subset of cancer patients alive at the end of 2016 who were not included in NCRI data because they were diagnosed before 1994. 

    It has been estimated that a cancer registry must be in existence for about 50 years before limited duration prevalence approximates to complete prevalence.3 Complete prevalence can be estimated in various ways.3 We have adapted a log-linear regression method (prevalence count as a function of time since diagnosis) to extend limited duration prevalence to estimate complete prevalence.4,5 This is considered a pragmatic approach which considers prevalence as an isolated statistic dependent on the dynamic interactions between historic incidence, mortality and survival data. 

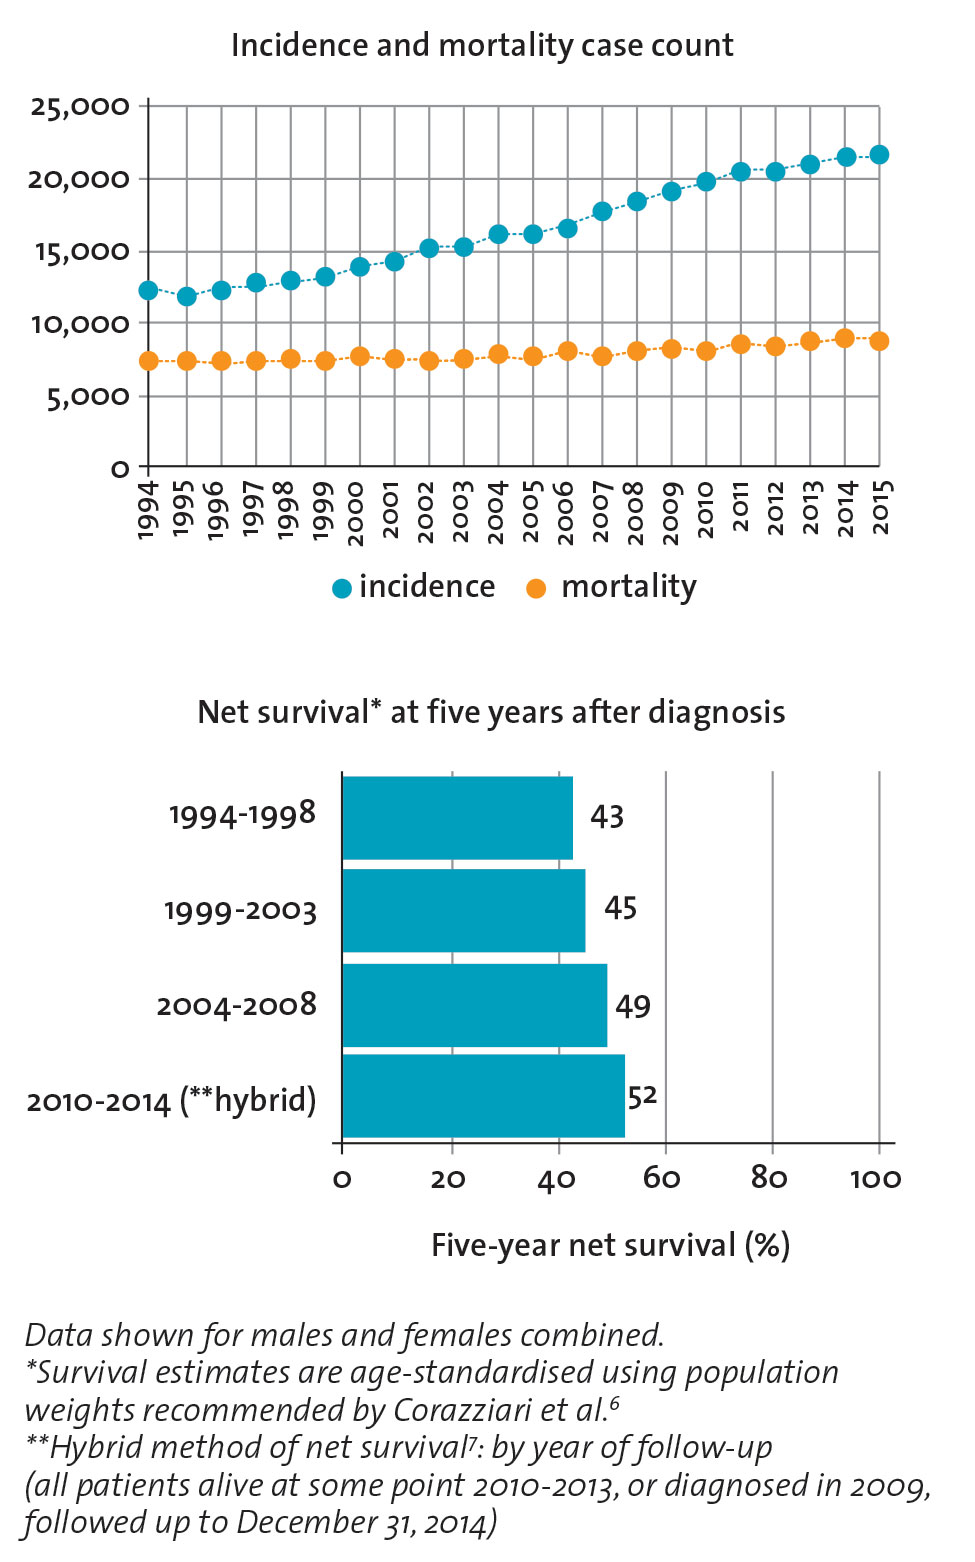
    Figure 1 shows that new cancer cases increased in line with the growing (and ageing) population from about 12,300 in 1994 to 21,700 in 2015. Mortality also increased to a lesser extent, from about 7,400 in 1994 to 8,800 in 2015. With increasing incident cases and a lesser increase in cancer deaths, the proportion that survived five years after diagnosis increased incrementally over time, from about 43% during 1994-1998 to 53% during 2010-2014.

    Figure 1: Trends in cancer incidence, mortality and survival: all invasive cancers, excluding NMSC (C00-43, C45-96): 1994-2015
    Figure 1: Trends in cancer incidence, mortality and survival: all invasive cancers, excluding NMSC (C00-43, C45-96): 1994-2015(click to enlarge)

    In this scenario of increasing incidence and improving survival, the number of persons in the population living with (or following) a cancer diagnosis increased (see Figure 2)

    Figure 2: Estimated complete cancer prevalence: 2012-2016
    Figure 2: Estimated complete cancer prevalence: 2012-2016(click to enlarge)

    The sum of the fixed-duration cancer survivor population (1994-2016) and estimated numbers of survivors from the hidden cancer subset (pre-1994) gives an estimate of complete prevalence, presented in Table 1:

    • At the end of 2016 it was estimated that there were 173,051 cancer survivors in Ireland, which comprised 3.65% of the Irish population in 2016 
    • The male/female proportions were 48% and 52% respectively and approximately 13.5% were under 50 years of age on December 31, 2016
    • These figures include patients still undergoing active treatment or palliative treatment at the end of 2016, in addition to longer-term survivors, either cured or potentially at risk of recurrence or relapse.

    Table 1: Estimated complete prevalence by sex and age: number of cancer survivors* at end of 2016
    Table 1: Estimated complete prevalence by sex and age: number of cancer survivors* at end of 2016(click to enlarge)

    The registry holds complete data up to the end of 2016. Complete prevalence increased by approximately 5% annually during 2012-2016. 

    The number of survivors of a given cancer type is related to its incidence rate, median age at diagnosis and survival prospects. Rare, high-fatality cancers diagnosed in elderly patients comprise only a small proportion of cancer survivors. Conversely, common cancers with good survival prospects diagnosed in younger persons will tend to predominate in the prevalent cancer population (see Figure 3)

    • Overall, the most common cancers in the prevalent cancer population were: breast cancer (23% of all cancer survivors), prostate cancer (20%), colorectal cancer (12%) and skin melanoma (7%) 
    • Lung cancer (a common but high-fatality cancer) accounted for only 3% of survivors, and less common, high-fatality cancers such as liver, pancreatic, oesophageal and stomach cancers and multiple myeloma together comprise < 3% of the cancer survivors
    • The top five most common prevalent cancers in males were prostate cancer (43% of all male cancer survivors), colorectal cancer (14%), skin melanoma (6%), testicular cancer (5%), and non-Hodgkin lymphoma (5%)
    • The top five most common prevalent cancers in females were: breast cancer (44% of all female cancer survivors), colorectal cancer (10%), skin melanoma (8%), uterine (6%) and cervical cancer (5%)
    • Certain cancers with good survival prospects, often diagnosed in younger patients, tended to predominate in the estimated prevalence for the period prior to 1994. This was most apparent for cancer of the testis. Conversely, for cancers with very poor survival, it was estimated that there were hardly any survivors still alive who had been diagnosed before 1994 (eg. cancers of the pancreas and liver) 
    • Detailed figures are not presented here, but just over 100,000 persons who had been diagnosed with non-melanoma skin cancer (NMSC) during 1994-2016 were also alive as of December 31, 2016. Relative survival at five years for these cancers closely approaches 100%.

    Figure 3: Number of cancer survivors: complete prevalence by cancer type and sex
    Figure 3: Number of cancer survivors: complete prevalence by cancer type and sex(click to enlarge)

    The numbers of cancers diagnosed increased annually due to growth of our population, which increased by over one million between 1996 and 2016.9 Moreover, the proportion of the population most likely to be diagnosed with cancer (65+ years) expanded by over 50% over the same 20-year period (see Figure 4).

     (click to enlarge)

    In combination with ongoing improvements in diagnosis, treatment and survival for most cancer types, this has resulted in growing numbers of cancer survivors in the general population. Planning for the long-term support and follow-up needs of cancer survivors is an   important health priority, as recognised by the recently published National Cancer Strategy.10

    References 
    1. O’Brien K, Comber H, Sharp L. Completeness of case ascertainment at the Irish National Cancer Registry, Ir J Med Sci, Aug. 2013
    2. Fritz AG. International classification of diseases for oncology: ICD-O. Geneva: World Health Organization, 2000
    3. Capocaccia R, De Angelis R. Estimating the completeness of prevalence based on cancer registry data, Stat Med, 1997: 16(4); 425-440
    4. Maddams J et al. Cancer prevalence in the United Kingdom: estimates for 2008, Br. J. Cancer, 2009; 101(3): 541-547
    5. United Kingdom and Ireland Association of cancer registries (UKIACR), Standard operating procedure: Guidelines for calculation of cancer prevalence. United Kingdom and Ireland Association of cancer registries (UKIACR). United Kingdom and Ireland Association of cancer registries (UKIACR), Apr-2018
    6. Corazziari I, M. Quinn, and R. Capocaccia, Standard cancer patient population for age standardising survival ratios, Eur. J. Cancer, vol. 40, no. 15, pp. 2307–2316, Oct. 2004
    7. Dickman, P and Coviello, E, Estimating and modeling relative survival, The Stata Journal, 2015; 15(1): 186-215
    8. CSO, Number of Births, Deaths and Marriages, http://www.cso.ie/en/statistics/birthsdeathsandmarriages/numberofbirthsdeathsandmarriages/ Accessed: Nov-2018
    9. Cancer in Ireland 1994-2016 with estimates for 2016-2018: Annual report of the National Cancer Registry (2018). NCRI, Cork, Ireland, 2018
    10. National Cancer Strategy: 2017-2026. Department of Health, Ireland (2017)
    © Medmedia Publications/Cancer Professional 2019