NUTRITION

Changes to healthy eating guidelines

New research into diet and obesity is improving our understanding of nutrition, and with it, countries worldwide are making changes to their healthy eating guidelines

Prof Donal O'Shea, Consultant Endocrinologist, St Vincent's University Hospital, Dublin and Dr Stephen Ludgate, Final-Year Medical Student, Trinity College, Dublin

April 1, 2015

Article
Similar articles
  • An economic study published by the McKinsey Global Institute in November 2014 listed obesity as one of the top three social burdens generated by humans that impact global GDP.1  It estimates the cost of obesity as $2 trillion per annum, just behind smoking and ‘violence, war and terrorism’.1  It highlights that promoting healthy eating is becoming more important than ever. 

    As new research into diet and obesity improves our understanding of nutrition,2,3 countries are beginning to adopt new policies when publishing their guidelines for healthy eating. In order to portray these changes, many countries have begun to change their established food pyramids and it has seen a number of interesting models released worldwide.

    From pyramid to spinning top

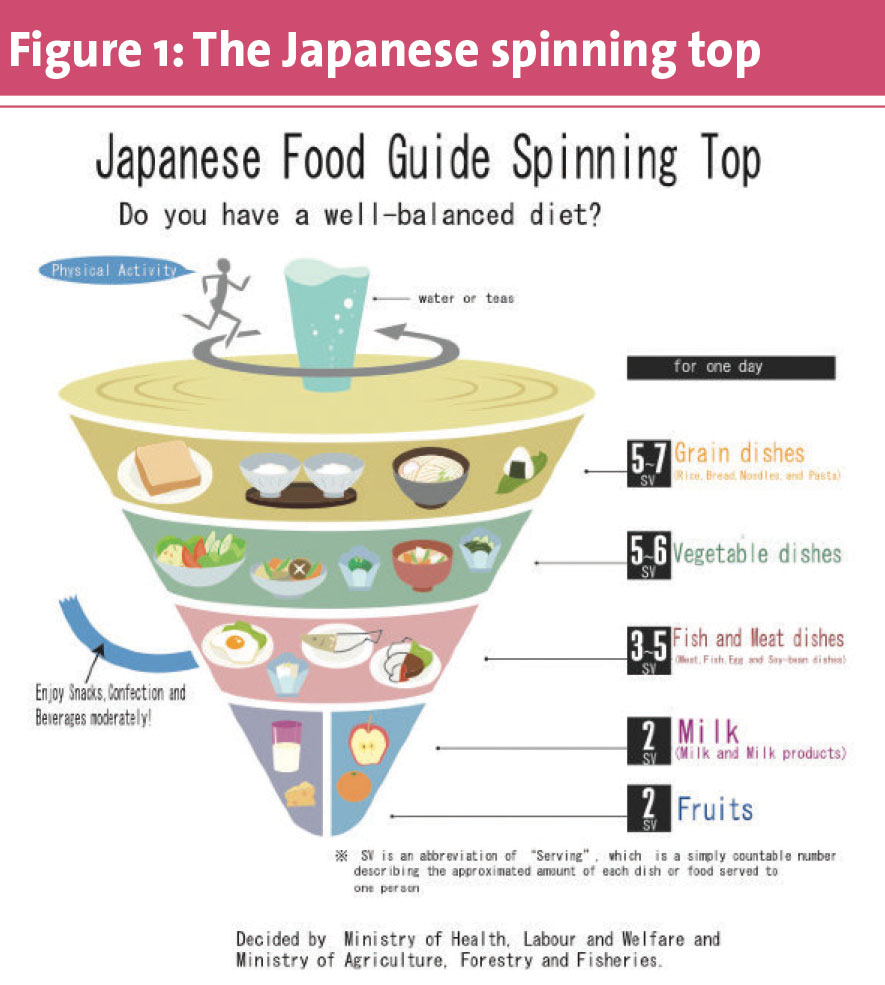
    One such example is Japan, which has inverted its food pyramid and turned it into a spinning top, putting the most important food groups to the top.4  The spinning top – koma in Japanese – was and still is a popular toy in the country and so it was felt that the population would be able to identify with it more easily.4

    In the Japanese graphic (see Figure 1), the spinning top is kept turning by a figure exercising on the top, which is seen as the key to a healthy lifestyle.  The handle of the spinning top is made of water and teas which is also seen as another essential part of the diet.  Snacks and confectionary have been completely removed from the model and interestingly, fruit has been placed at the bottom of the spinning top and limited at two servings per day, along with dairy produce.4

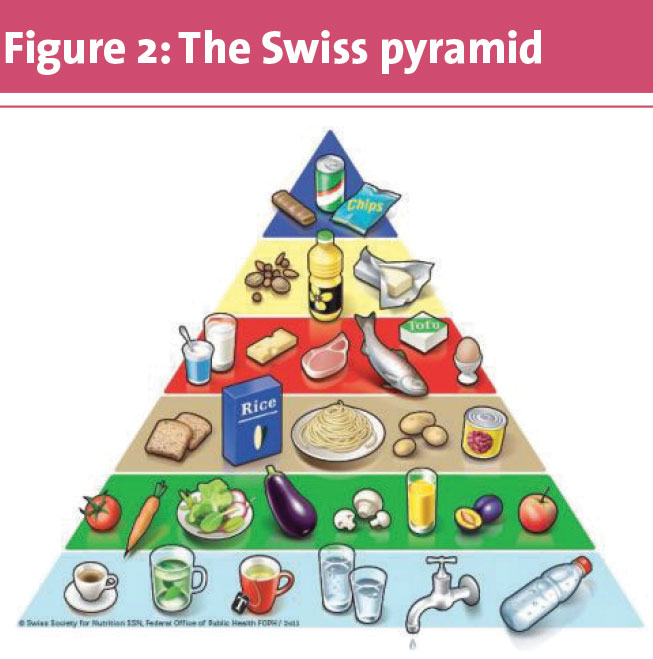
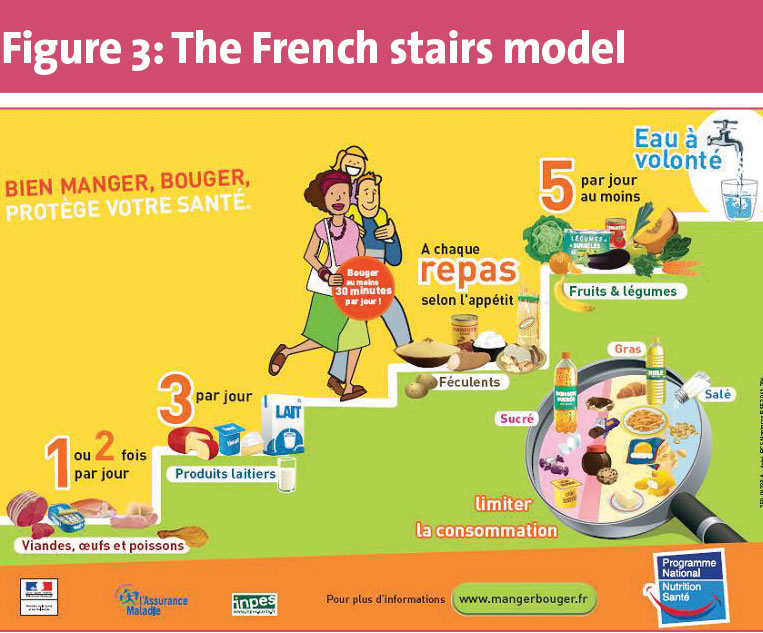
    Many changes to the portrayal of dietary models have also been seen in Europe in recent years. A number of countries including Switzerland,5 Belgium,6 Latvia,7 France,8 and Germany,9 along with many others, have included water and fluids in their new food pyramids.  Many of these, for example Belgium,6 have made it the new base of their pyramid.

     (click to enlarge)

     (click to enlarge)

    More emphasis on vegetables and fruits 

    Perhaps the most interesting change in European guidelines has occurred in Switzerland, Austria and Finland, where fruit and vegetables have moved below grains and cereals in the classic pyramid, reversing the traditional order.5,10,11 The guidelines in these countries now state that fruit and vegetables should be the largest part of our diet (see Figure 2)

    One Swiss graphic is particularly interesting as the information to the side of the pyramid gives dietary comparisons between basic and athletic diets.12 It states that an extra serving of carbohydrates should be consumed for each hour of exercise completed per day. Many people will also be surprised that it recommends athletes consume an extra half portion of ‘oils, fats and nuts’ for each hour of exercise completed, but states that no extra servings of dairy or protein are required.12

    In the French graphic (see Figure 3), the traditional pyramid has been replaced by a set of stairs with a family walking up the stairs representing the importance of exercise.8 The most important components of the diet are placed at the top of the stairs with water listed as the most essential part of the diet followed by fruits and vegetables – another example of where this food group has been placed above grains and cereals in the diet – with eggs, meat and fish found at the bottom.8

     (click to enlarge)

    Sugary snacks and fats have not been placed on the stairs, but information on these is given within the graphic.

    Germany has also replaced the traditional food pyramid and they have opted for a three-dimensional pyramid instead.9 The pyramid has an extremely complex design with each food group placed on one side of the pyramid. Foods within these groups have been ranked in importance in the diet with a traffic light system along the left-hand side of each group, and then the bottom of the pyramid recommends the ratio that the different groups should be consumed in.9

    While very accurate, this model may be too complex to effectively portray the message of healthy eating to the population.

    Guidelines by frequency and plate

    Greece has split its pyramid into three sections for foods that should be eaten daily, weekly and monthly and is based on the Mediterranean diet.13 Physical activity, grains and cereal and fruit and vegetables are listed in the daily section along with olive oil. Poultry, fish and eggs are listed as foods that should be consumed several times per week along with a maximum serving of three sugary foods per week.  Red meat is the only food group to be placed in the monthly category and is capped at four servings per month.13

    Another graphic which is also being used is the ‘dinner plate’; and countries opting for this include the UK14 and the US.15  These graphics all split the plate into different segments, with each one representing a different food group.  

    The size of these segments represents the portion of the diet each food group should make up. The UK model is the only one of the three to include high fat and sugar foods while the US model also lists fruit and vegetables as a larger part of a healthy diet than grains and cereal, taking up half of the plate in the graphic.14,15

    The next 20 years will see a big change in our understanding of the optimum diet and lifestyle. Current recommendations are beginning to reflect this emerging evidence – however the statement from 1863 ‘You are what you eat’ is unlikely to be displaced.

     (click to enlarge)

    References
    1. Dobbs R, et al.  Overcoming obesity: An initial economic analysis.  McKinsey Global Institute.  November 2014
    2. Food Safety Authority of Ireland.  Scientific Recommendations for Healthy Guidelines in Ireland. 2011 
    3. U.S. Department of Agriculture and U.S. Department of Health and Human Services.  Dietary Guidelines for Americans.  2010
    4. Japanese Ministry of Health, Labour and Welfare and Ministry of Agriculture, Forestry and Fisheries.  Japanese Food Guide Spinning Top.  July 2005.  Available from: www.mhlw.go.jp
    5. Swiss Food Pyramid.  Recommendations for a healthy and enjoyable adult diet.  www.ag.ch
    6. Available from: www.health.belgium.be
    7. Available from: www.vm.gov.lv
    8. Available from: www.mangerbouger.fr/
    9. Oberritter H, Schäbethal K et al.  The DGE Nutrition Circle – Presentation and Basis of the Food-Related Recommendations from the German Nutrition Society (DGE). DOI: 10.4455/eu.2013.004. 2013
    10. Available from: www.fao.org/nutrition/education/food-based-dietary-guidelines/regions/countries/austria
    11. Available from: www.ravitsemusneuvottelukunta.fi
    12. Swiss Forum for Sports Nutrition and Swiss Society for Nutrition. 2009.  Available from: www.sfsn.ch
    13. Ministry of Health and Welfare.  Dietary guidelines for adults in Greece
    14. The Department of Health United Kingdom.  Your guide to the eatwell plate. 2011
    15. USDA. ChooseMyPlate. 2011 Available from: www.choosemyplate.gov
    © Medmedia Publications/Professional Diabetes & Cardiology Review 2015